
Statistics

Death Row Since 1974
Table 1 shows the year-by-year population of death row from 1974 to the present. In the table, "Died" includes all death row prisoners who died by any cause other than execution. This includes deaths by natural causes, accidents, suicide, murder, and death during attempted escape. The "Removed" column counts those prisoners who were removed from death row, including overturned convictions, reduced sentences, commutations, pardons, and transfers to federal custody.
| Jan. 1 Population |
Executed | Died | Removed | Added | |
|---|---|---|---|---|---|
| 1974 | 0 | 0 | 1 | 0 | 9 |
| 1975 | 8 | 0 | 0 | 0 | 22 |
| 1976 | 30 | 0 | 0 | 0 | 24 |
| 1977 | 54 | 0 | 0 | 2 | 20 |
| 1978 | 72 | 0 | 0 | 5 | 44 |
| 1979 | 111 | 0 | 1 | 6 | 22 |
| 1980 | 126 | 0 | 0 | 10 | 28 |
| 1981 | 144 | 0 | 1 | 14 | 25 |
| 1982 | 154 | 1 | 0 | 19 | 29 |
| 1983 | 163 | 0 | 2 | 14 | 25 |
| 1984 | 172 | 3 | 0 | 4 | 23 |
| 1985 | 188 | 6 | 0 | 3 | 37 |
| 1986 | 216 | 10 | 2 | 4 | 43 |
| 1987 | 243 | 6 | 1 | 11 | 37 |
| 1988 | 262 | 3 | 0 | 3 | 35 |
| 1989 | 291 | 4 | 0 | 5 | 29 |
| 1990 | 311 | 4 | 1 | 4 | 29 |
| 1991 | 331 | 5 | 0 | 5 | 30 |
| 1992 | 351 | 12 | 1 | 6 | 32 |
| 1993 | 364 | 17 | 2 | 14 | 37 |
| 1994 | 368 | 14 | 0 | 6 | 47 |
| 1995 | 395 | 19 | 1 | 5 | 43 |
| 1996 | 413 | 3 | 0 | 3 | 39 |
| 1997 | 446 | 37 | 2 | 4 | 35 |
| 1998 | 438 | 20 | 3 | 4 | 42 |
| 1999 | 453 | 35 | 2 | 5 | 48 |
| 2000 | 459 | 40 | 2 | 2 | 30 |
| 2001 | 445 | 17 | 2 | 2 | 31 |
| 2002 | 455 | 33 | 3 | 4 | 36 |
| 2003 | 451 | 24 | 0 | 2 | 29 |
| 2004 | 454 | 23 | 3 | 7 | 25 |
| 2005 | 446 | 19 | 1 | 31 | 15 |
| 2006 | 410 | 24 | 3 | 3 | 11 |
| 2007 | 391 | 26 | 0 | 8 | 15 |
| 2008 | 372 | 18 | 2 | 8 | 9 |
| 2009 | 353 | 24 | 0 | 9 | 11 |
| 2010 | 331 | 17 | 3 | 6 | 9 |
| 2011 | 314 | 13 | 1 | 8 | 8 |
| 2012 | 300 | 15 | 2 | 2 | 9 |
| 2013 | 290 | 16 | 1 | 7 | 9 |
| 2014 | 275 | 10 | 0 | 2 | 11 |
| 2015 | 274 | 13 | 2 | 7 | 2 |
| 2016 | 254 | 7 | 2 | 6 | 4 |
| 2017 | 243 | 7 | 2 | 4 | 4 |
| 2018 | 234 | 13 | 0 | 4 | 6 |
| 2019 | 223 | 9 | 1 | 2 | 5 |
| 2020 | 216 | 3 | 2 | 7 | 2 |
| 2021 | 206 | 3 | 3 | 5 | 3 |
| 2022 | 198 | ||||
| Total | 573 | 55 | 292 | 1,118 |
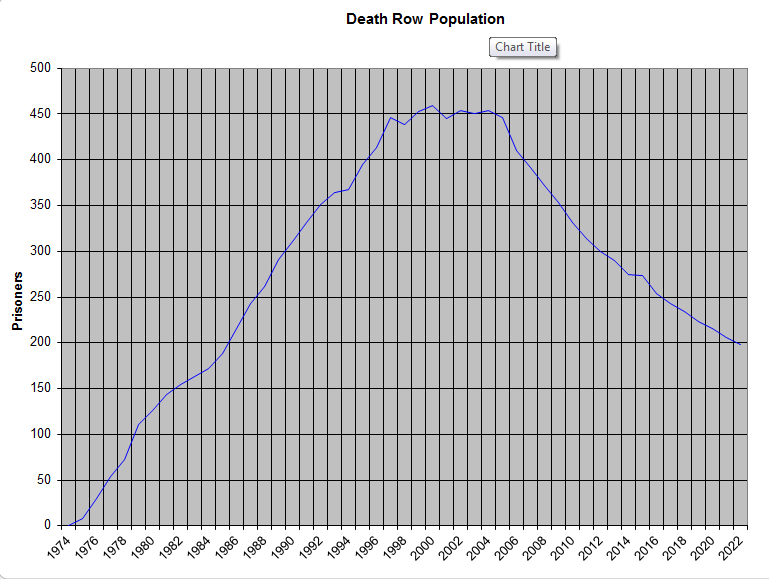
Figure 1 shows the year-by-year Texas death row population in line graph format. Again, population totals refer to 1 January of the given year.
Copyright © 2002-2024 by David Carson. Unauthorized publication, either printed or electronic, is prohibited. This includes posting to Usenet, blogs, and message boards.